With today’s advanced charting platforms, virtually any trader can access this type of market analysis to identify where (price) trading activity took place and how much (volume) trading took place at each price level.
Here, we take a closer look at the volume profile and explain how it can be used to identify trade entries and exits.
Volume Profile Review
Many traders are used to viewing volume as a histogram beneath a price chart. This approach shows the amount of volume traded during each price bar, whether it’s a time-based bar (such as one-minute) or an activity-based bar (such as 144-tick or 2000-tick volume). While this is a popular way to analyze volume, knowing where the volume occurs—in terms of price, rather than time—can be more meaningful.
Volume Profile Plotted on Vertical Chart Axis
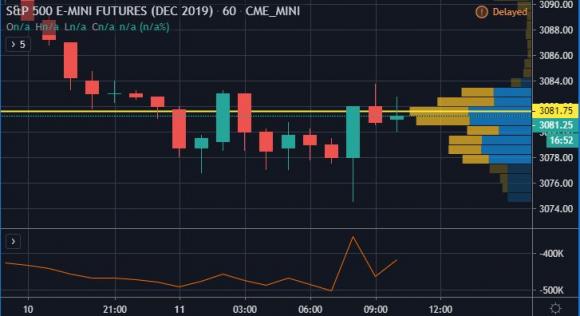
Volume profile, plotted on the vertical axis of the price chart, does just that: It shows how much trading activity has taken place at each price level touched throughout the trading session. Why is this helpful to traders? Volume profile points out the prices that have been favored by the market as well as those that have been ignored, which can give traders clues about where price is likely to go in the near future.
Identify High Volume and Low Volume Areas For Trading Opportunities
Volume profile updates every time a new trade order in the market is filled, and the point of control, value area, high volume nodes, and low volume nodes all change numerous times throughout a given trading session—especially on actively traded instruments—as more volume activity is recorded. As volume profile develops throughout the trading session, new
patterns and trading opportunities emerge.
For instance, at 11 a.m., following the morning push, the point of control may be located at the top of the chart (towards the session high), only to be replaced later in the session with higher trading volume moving the point of control to a price centered on the chart.
For active traders, it is the developing volume profile that is most relevant. The volume profile at the end of the day will show the history of volume, but not the patterns that could pinpoint trading opportunities during an active trading session. It is this constant evolution of the volume profile during a trading session that can help form trading decisions.
Volume Profile High Volume Nodes Are Like Gravity
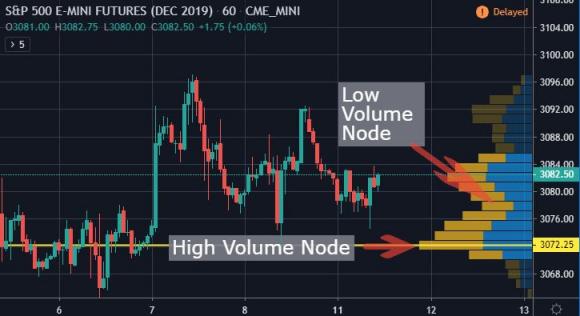
The developing high-volume nodes always show where the most significant intraday trading has taken place thus far, reflecting the most popular prices for the session. The low-volume nodes, on the other hand, show prices that have received little attention so far and were basically skipped over by market participants.
It may be helpful to think in terms of gravity: the high-volume nodes (which have shown a lot of trading activity already) have a strong pull, much like gravity. Traders tend to gravitate toward these areas over and over throughout the trading session, whether prices are rising or falling.
Trades Typically Move Fast Through Low Volume Nodes
Conversely, the low-volume nodes are areas without much gravity. The market often bounces right over these levels, not staying for long because there’s not much gravitational pull. As such, even though these price levels are visited, they often remain low-volume nodes throughout the entire trading session.
It is this cyclical nature of high and low-volume nodes that can point out trading opportunities. The market frequently revisits the prices where the gravitational forces of the nodes pull and push prices back and forth repeatedly throughout the session. This can occur in all market conditions but is most prevalent in consolidating markets that have yet to form a strong trend.
High Volume Nodes Identify Trading Areas of Support and Resistance
Price levels that have formed high-volume nodes can be used to identify areas where the “smart money” is trading and often represent key areas of support and resistance. Support and resistance levels in the market represent zones where prices tend to oscillate and stall before breaking out to form a new zone. Support (or, floor of the zone) and resistance (ceiling of the zone) are largely driven by human emotions and behavior. In a way, price charts can be thought of as graphical representations of emotions like fear and greed, optimism and pessimism, and human behavior such as herd instinct.
Fear and greed, for example, have a strong influence on support and resistance levels. As price falls back to a support level, the traders who are already long will often add to positions to make more money; the traders who are short will frequently buy to cover because they are afraid of losing money. Herd instinct is also demonstrated in this example as traders tend to congregate near (and further strengthen) these support and resistance levels, increasing the volume and creating high-volume nodes in the volume profile.
For this reason, high-volume nodes often correlate with the swings in price that are generally used to define support and resistance levels. Stronger support and resistance levels can be identified when they align with larger high-volume nodes. In this way, volume profile analysis can help determine the significance of a support or resistance level and help show how market participants are reacting to future expectations.
Trading with Volume Profile
Due to the dynamic nature of volume profile, it can be especially useful as a tool to identify intraday trade entry and exit points. To begin, the formation of a point of control and value area can point out a direction that price may head in the future and will be most significant after there has been considerable trading activity (that is after the trading session has been open for a couple of hours).
 Since the value area and point of control represent high gravity areas where participants have seen the most value if the current price falls outside this zone, it may provide a bias: long, if the current price is below the point of control (shown in “Finding value,” right); short, if the current price is above the point of control.
Trading Low Volume and High Volume Node Example
In our example, we’ll look at a potential entry location by searching for a low-volume node. Low-volume nodes can provide good trade entry locations since they represent prices that have been skipped over in the past, and trading activity will likely move quickly away. We’ll look for this to occur again as we anticipate price moving in the direction of the point of control. Placing a buy stop order at the first low-volume node above the current price can provide a good entry into a long trade. In our example, we use the chart in “Finding value” to set a buy stop order at the low volume node above the current price.
 The high-volume nodes can provide a high-probability location for trade exits. Because market participants have already found these prices attractive earlier in the session, this can represent a good opportunity to sell. “Trade management” (right) shows where potential trade exits are placed to correspond with the high volume nodes above the trade entry. In this example, we use two trade exits: profit target 1 and profit target 2. A protective stop-loss order was placed just beneath a high-volume node; doing so minimizes the chance of getting stopped out if price bounces down to the HVN and then back up.
 “Exit analysis” (right) shows that price reaches the high volume notes, and the trade is exited at profit target 1 and profit target 2. If price continues to rise and goes above the value area, the next setup to watch for would be a possible short entry because price may return to the day’s point of control. Traders who prefer not to go short would wait for the next opportunity where price is below the point of control.