Home › Market News › Trading ABC Patterns
Markets demonstrate repetitive patterns where prices oscillate between one set of price ratios and another making price projections possible. Market trends can be defined by geometric relationships as they exhibit harmonic relationships between the price and time swings. Many investors/traders use cycles and harmonic relationships to project future swing prices/times. These harmonic price movements produce symmetric rallies and decline to give traders an advantage to determine the key turning points. Symmetry is visible in all markets and in all time frames.
The ABC chart pattern and its related AB=CD chart pattern are prime examples of symmetry in the markets. These harmonic patterns help traders to identify buying and selling opportunities in all markets and in all time frames. The ABC and AB=CD patterns are first described by H.M. Gartley in his book “Profits in the Stock Market.” The main advantages of trading harmonic patterns are that they allow traders to determine risk versus reward ratios beforehand as they forecast key market turning points and profit targets for traders. Here, we describe how to trade “ABC” chart patterns. The ABC pattern can be a continuous or reversal pattern, and it is shaped like a lightning bolt.
The key point in identifying an ABC and AB=CD pattern is to correctly detect the A, B, and C key inflection (pivot) points in a chart while they are forming. These inflection points are determined by key swing highs and lows of various levels, and their correction waves to determine distinct swings. The potential C point is usually forecasted by the Fibonacci retracements (0.38 to 0.618) of AB Swing. Once A, B, and C points (and AB, BC legs) are identified, a projection algorithm is applied to compute the Potential Completion Zone (PCZ). This PCZ area is where the ABC pattern is expected to complete and may signal a continuation of its trend in the first trend direction (AB). Following the completion of the BC leg, the projections of AB and BC legs (using Fibonacci ratios) are plotted (from C) to generate targets. The ABC pattern is traded in the trend direction of AB from C to D.
“Know your ABCs,” below, show both ABC Bullish and ABC Bearish formations using trade information in TradeStation software.
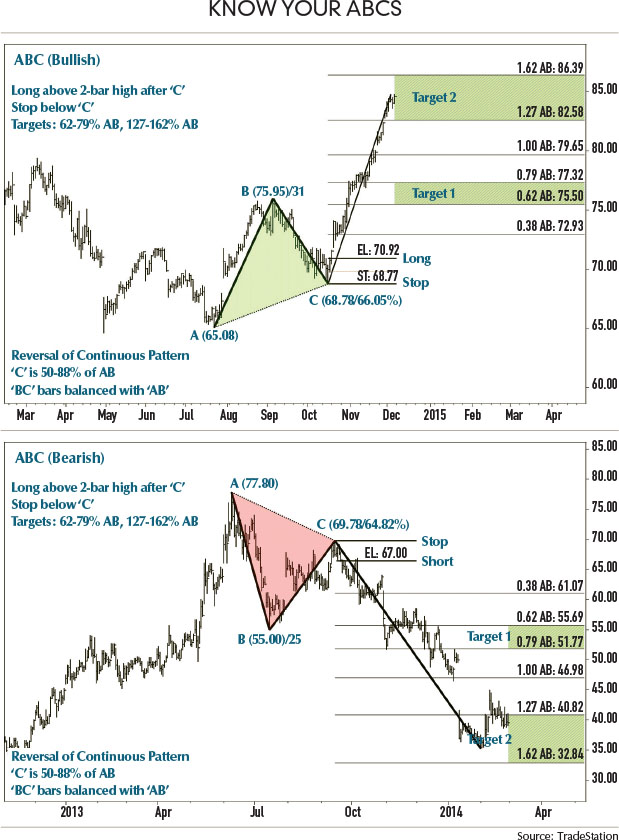
The swing legs (AB and BC) in the ABC pattern are generally in symmetrical proportions both in price and time with consistent slopes. The tradable CD leg has a harmonic relation with symmetry for AB and BC swings. The ABC bullish structures are formed after a prolonged prior downtrend or consolidation trends, whereas bearish ABC patterns are formed after a prior uptrend.
A PCZ is computed using AB swing and Fibonacci ratios (50-88.6% of AB). This PCZ area is where a “C” pivot is formed at the end of a BC swing that signals the completion of an ABC pattern.
After an ABC pattern is completed, it is advisable to wait for the pattern to confirm a reversal signal using any momentum-based indicator or price confirmation mechanisms. There are various confirmation and trade entry methods, but one of the best methods is when price crosses a 2-bar high after “C” in an ABC bullish pattern or a 2-bar low after “C” in an ABC bearish pattern.
A “Stop” is placed a few ticks below C (if bullish) or a few ticks above C (if bearish) levels.
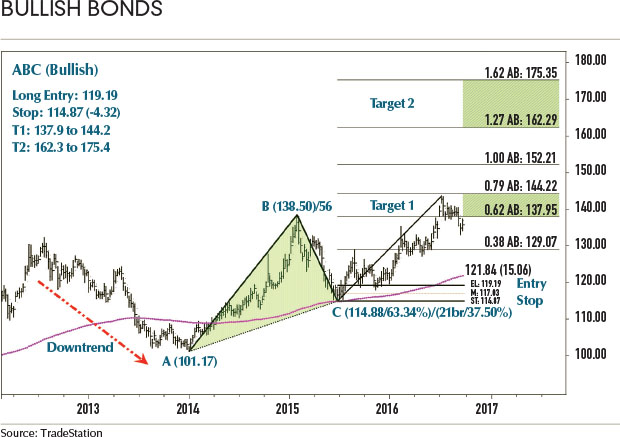
The ABC pattern targets are computed using the AB and BC swings. The height pattern (AB) is used to project target levels from C-level using Fibonacci ratios. The first target zone is (62-79% AB) from “C” and the second target zone is (127-162% AB). A secondary target level is set at 100% AB Level at 152.21.
The Fibonacci relationships aid in finding an approximate area (PCZ) where the pattern may be complete. Precise ratio levels for reversals or targets in patterns are very rare and a tolerance ratio of +/- 2% is added for the Fibonacci ratios. Pattern confluences with other patterns, support/resistance areas, moving averages, and other market context elements must be used to identify and validate the pattern structure.
example
“Bullish bonds” (below) show the auto-generated ABC bullish pattern formation in the current 20-year Treasury Bond ETF TLT chart from 2012 to 2016. Here are some of the key points and how it is traded.